

The City of Miami Springs Finance Director prepared the following memorandum for the 2023-24 budget workshop meetings. It also includes the revenues and expenditures from past years as well as the initial proposals for the 2023-2024 fiscal year.
Below you’ll find:
- Memo from the City Finance Director
- Listing of Possible Cost Reductions
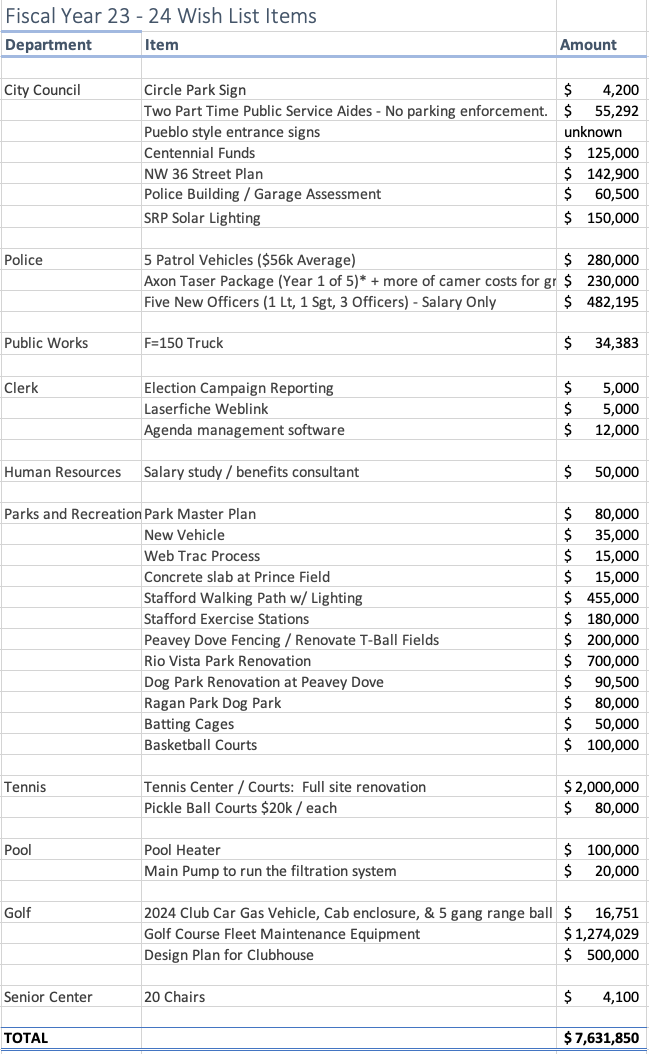
- 2023-24 Wish List Items
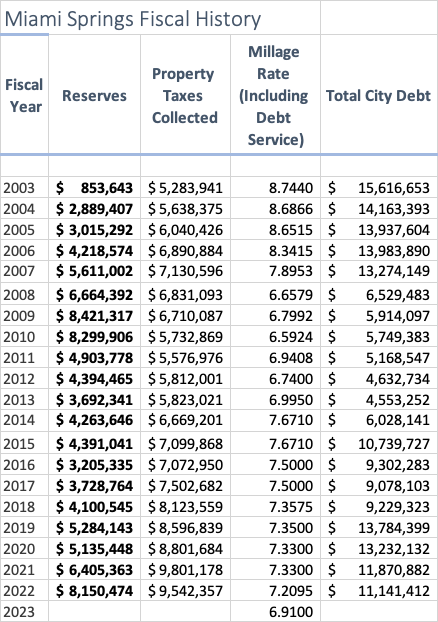
- Fiscal History
- Annual Revenue Comparison
- Spending by Department
- Top Expenditures
- City Employee Pay Ranges
What areas do you believe deserve more spending? What areas do you believe deserve more cuts? Review the details below and share your thoughts in the comments section.

In preparation for the first budget workshop scheduled for August 7, 2023, we are presenting Council with the FY 23-24 budget workbook which includes various options and alternatives to assist Council in making sound financial decisions when addressing the proposed FY 23-24 budget.
At the millage rate cap of 6.9900, the budget would show a deficit of $594,603 that may be funded from available fund balance.
At the current operating millage rate of 6.9100, the budget will create a deficit of $716,625. This scenario also includes the budget assumptions detailed below and does not include any items on the wish list.
Each reduction of .10 in millage is equivalent to $152,528 for FY 23-24.
The total General fund budget is $23,111,476 of which $14,121,576 or 61.1% represents employee salaries and benefits. The remainder of $8,989,900 is to cover all other City needs.
The following are the more significant budget funding requirements:
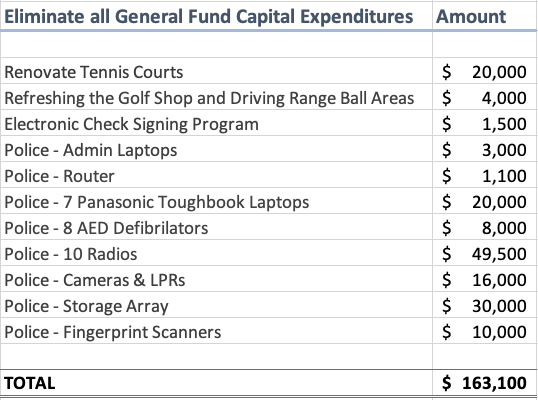
- For FY 23-24 we have capital expenditures of approximately $163,100 in the General fund, which includes the following;
- Parks and recreation has $20,000 to renovate tennis courts,
- Finance has $1,500 for an electronic check signing program,
- Golf has $4,000 for refreshing the shop and driving range ball machine areas,
- Police has
- $3,000 for two admin laptops,
- $1,100 for one router,
- $20,000 for seven Toughbook laptops, (That’s $2,857 per laptop)
- $8,000 for five AED Defibrillators, (That’s $1,600 per defibrillator)
- $49,500 for ten radios, (That’s $4,950 per radio)
- $16,000 for cameras and license (grant funded),
- $30,000 for storage array (grant funded) and
- $10,000 for fingerprint scanners.
The following are other funds that do not affect the general fund:
-
-
- The Sanitation department, which is an Enterprise fund, included $34,383 for a new Ford F-150 Regular Cab XL 4×2
-
Other General Fund Costs:
-
-
- The FY 23-24 budget includes a 4% COLA (Cost of Living Adjustment) for all general employees, total General fund cost of this is approximately $213,000.
- For FY 23-24 we will be adding an additional part time code compliance officer.
- Health insurance costs will increase by 8.5% for FY 23-24
- Total cost of this increase in General fund is approximately $128,000
- Property insurance costs will increase by approximately 140% for FY 23-24. Total cost of this increase in General fund is approximately $419.000
- The City is currently in union negotiations with the FOP.
- The Police budget includes retirement payouts in the amount of approximately $159,000.
- Budget includes an approximate annual increase in the City Manager budget of $155,000.
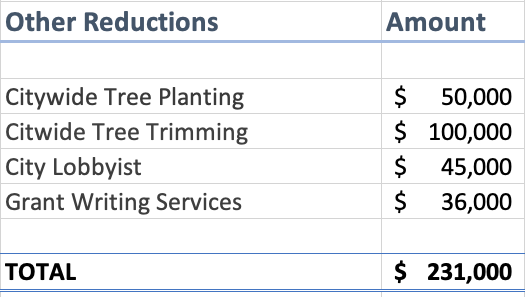
- The City Manager budget includes $45,000 tor the City’s lobbyist, as well as $36,000 for grant writer services.
- Increase in Senior Center funding of approximately $210,000.
- The Public Works budget includes $50,000 for citywide tree planting, and $100,000 for tree trimming.
- Council budget includes:
- $35,000 funding request from CMI (Curtiss Mansion) for next fiscal year,
- $14,000 for the River Cities Festival, and
- $6,000 request from the Historic Museum for storage costs.
-
The city has accumulated a healthy unassigned fund balance over the years in order to meet unexpected events or disasters. It is projected that at the end of FY 23 the available and unassigned general fund balance will be approx. $7.0 million.
As you are aware, the Government Finance Officers Association (GFOA) recommends a reserve of 15% of annual budgeted expenditures. A few years ago, the City Council and Administration established an internal policy that the reserve level should be 25%. For FY 23-24 the reserve at the 15% level would be approx. $3.5 million while at 25% the reserve would be $5.8 million. The current policy states that if reserves fall below 25%, the city would need to plan to replenish the reserves back to the 25% level
within the following two fiscal years.
Pages 1-3 provides some possible reductions based on past history and experience with previous budget workshops. Some of the proposed reductions affect service levels and some do not, some affect employee pay and benefits while others affect current programs and subsidies. Pages 1-4 lists some budget considerations (wish list) that are not included in the budget discussed above but are presented for Council discussion and consideration. Page 1-5 is a financial dashboard showing the history of millage rates for the past 20 years as well as fund balances during these years. Page 1-6 provides Council with a graphic view of the City’s funds and their relation to each other and to the General fund.
FY 2023-24 LISTING OF POSSIBLE COST REDUCTIONS
Tho original City Manager’s Proposed Budget for FY 2023-24 is based on an operating millage of 6.9900 whlch results in a deficit of $607,911 to be funded by available fund balance.
The current status of the budget at a 6.9900 millage Is a deficit of $507,911.
1 – Annual Event Subsidies:

2 – Eliminate all General Fund Capital Expenditures:
3 – Personnel Related Reductions:
-
- Across the board 4% COLA for General Employees ( each 1% ccsts S53,167)
- $212,669
- Addition of one Part Time Code Compliance Officer
- $27,989
- Across the board 4% COLA for General Employees ( each 1% ccsts S53,167)
4 – Personnel Related Reductions:
Miami Springs Fiscal Year 2023-2024 Wish List Items:
Miami Springs Fiscal History:
REVENUE COMPARISON – GENERAL FUND
| Revenue Comparison – General Fund | ||||
| Line Item Revenue | FY 20-21 | FY 21-22 | FY 22-23 Amended Budget | FY 23-24 Proposed Budget |
| Ad Valorem Taxes• Current | 9,801,178 | 9,542,357 | 9,517,252 | 10,661,710 |
| Ad Valorem Taxes • Delinquent | – | – | 50,000 | – |
| Franchise Fees | 939,458 | 1,120,195 | 989,000 | 1,038,450 |
| Utility Service Taxes | 1,329,338 | 1,408,319 | 1,340,000 | 1,407,000 |
| Local Communications Tax | 477,957 | 369,153 | 441,585 | 472,496 |
| Occupational Licenses-City | 60,435 | 60,426 | 71,000 | 71,000 |
| Occupational Licenses-County | 25,703 | 22,633 | 24,000 | 24,000 |
| Zoning Fees | 53,360 | 45,600 | 48,000 | 40,000 |
| Misc Plan Reviews | 950 | 850 | 500 | 500 |
| State Revenue Sharing | 529,374 | 637,956 | 583,643 | 623,122 |
| Alcoholic Beverage License | 10,991 | 13,232 | 10,000 | 10,000 |
| 1/2-cent Sales Tax | 1,166,349 | 1,422,478 | 1,206,143 | 1,288,352 |
| Local Option Gas Tax | 342,118 | 366,008 | 373,602 | 399,754 |
| Gas Tax Rebate | 15,988 | 10,868 | 15,000 | 15,000 |
| Total Government Tax Revenue | 14,753,199 | 15,020,075 | 14,669,725 | 16,051,384 |
| Summer Camp Activity Fees | 6,350 | 19,600 | 30,000 | 30,000 |
| Summer Camp | 93,238 | 103,840 | 120,000 | 120,000 |
| Fitness Room Membership | 21,569 | 19,696 | 20,000 | 20,000 |
| After School Program | 8,516 | 17,927 | 45,000 | 45,000 |
| Gym Admission Fees | – | 4,566 | 2,500 | 2,500 |
| Get Fit Summer Camp | 500 | – | – | – |
| Vending Machines | 270 | 1,559 | 3,500 | 3,500 |
| Basketball Fees | 3,825 | 20,850 | 18,000 | 20,000 |
| Flag Football | – | 17,938 | – | 10,000 |
| Pelican Theatre | 749 | 4,290 | 5,000 | 5,000 |
| Jazzercise | 644 | 1,346 | 1,300 | 1,300 |
| Daddy/Daughter Dance | – | 3,440 | 5,000 | 5,000 |
| Other Annual Events | 2,550 | 9,603 | 13,000 | 13,000 |
| Fireworks-VG | 3,000 | 4,000 | 4,000 | 4,000 |
| Rec Center / Rec Dept Revenues | 141,211 | 228,655 | 267,300 | 279,300 |
| Pool Admissions/Lessons | 115,022 | 160,484 | 97,000 | 130,000 |
| Pool Rental | 10,020 | 10,336 | 10,000 | 10,000 |
| Pool Memberships | 21,891 | 25,995 | 20,000 | 20,000 |
| Pool Party Room Rental | 9,130 | 20,277 | 14,000 | 14,000 |
| Pool Cabana / Umbrella Rentals | 9,658 | 22,850 | 12,000 | 12,000 |
| Pool Revenues | 165,721 | 239,942 | 153,000 | 186,000 |
| Golf Green Fees | 1,499,609 | 965,776 | 1,173,000 | 2,140,200 |
| Cart Fees | – | 572,995 | 30,000 | 73,080 |
| Golf Merchandise/Food & Beverage Sales | 149,512 | 155,900 | 88,200 | 154,860 |
| Golf Range Fees | 284,670 | 275,691 | 245,000 | 339,300 |
| Misc. Club Rental/lessons | 29,935 | 34,999 | 8,800 | 42,717 |
| Golf memberships | 131,709 | 103,008 | 45,000 | 53,070 |
| Golf Revenues | 2,095,435 | 2,108,369 | 1,590,000 | 2,803,227 |
| Miscellaneous Charges for Serv | – | 19,360 | 500 | 500 |
| Copies & Other Charges | 6,067 | 2,817 | 6,000 | 5,000 |
| Lien Search | 32,150 | 33,450 | 30,000 | 20,000 |
| Re-Occupancy Inspection fees | 20,375 | 16,875 | 20,000 | 15,000 |
| Clerk of the Court • Fines | 53,026 | 205,470 | 140,000 | 145,000 |
| Code Enforcement tickets | 182,905 | (118,830) | 75,000 | 50,000 |
| Admin Fees / Fines | 294,523 | 159,142 | 271,500 | 235,500 |
| Disabled Parking tickets | – | – | 19,594 | 19,500 |
| Red Light Fines | 614,773 | 1,130,632 | 1,157,526 | 1,100,000 |
| Administrative Fee-Red Light hearings | 15,766 | 19,447 | 20,000 | 15,000 |
| Police grant – FL Digital | – | – | – | 500,000 |
| Other Grants | 348,119 | 16,395 | 6,416 | 5,000 |
| Police Fees / Grant Revenues | 978,658 | 1,166,474 | 1,203,536 | 1,639,500 |
| Interest – Investments | 9,861 | 10,733 | 30,000 | 50,000 |
| Interest• Tax Collections | 3,231 | 7,341 | 6,000 | 6,000 |
| Rent • Metro Fire | 13,665 | 16,638 | 14,000 | 14,000 |
| Rent • Dade Co. Library | 8,253 | 8,253 | 8,500 | 8,500 |
| Rent • Bus Benches | 3,845 | 4,488 | 4,500 | 4,500 |
| Recreational Activities | 1,330 | 17,540 | 20,000 | 20,000 |
| Sprint Tower | 101,002 | 103,875 | 104,000 | 105,000 |
| Rent-Country Club | 37,000 | 49,196 | – | 60,000 |
| Senior Center Rentals | – | (800) | – | – |
| Surplus Sale of Equipment | 1,400 | 18,975 | 25,000 | 20,000 |
| Govt Business Revenues | 179,587 | 236,239 | 212,000 | 288,000 |
| Other Miscellaneous Fees | 133,483 | 156,110 | 127,000 | 75,000 |
| Returned Check Charges | 18 | 559 | 800 | 250 |
| Code Enforcement Liens | 2,775 | 8,695 | 4,000 | 2,500 |
| ITF – Building Fund | 323,748 | 331,388 | 408,210 | 408,210 |
| ITF – Capital Projects Fund | – | 918,868 | 216,139 | – |
| ITF – Sanitation Admin Fee | 370,000 | 370,000 | 470,000 | 470,000 |
| ITF – Stormwater Admin Fee | 60,000 | 60,000 | 60,000 | 60,000 |
| Appropriated Fund Balance | – | 814,735 | 594,603 | |
| Proceeds from Debt | – | 105,000 | 500,000 | – |
| School Crossing Guards | 2,765 | 17,982 | 18,000 | 18,000 |
| Other Govt Revenues | 892,789 | 1,968,602 | 2,618,884 | 1,628,563 |
| TOTAL GOVT REVENUES | 19,501,123 | 21,127,498 | 20,985,945 | 23,111,474 |
Spending by Department:
| Expenditures by Department | ||||
| Department | FY 20-21 | FY 21-22 | FY 22-23 Amended Budget | FY 23-24 Proposed Budget |
| Mayor & City Council | 138,126 | 164,687 | 185,420 | 161,842 |
| Office of the City Manager | 501,129 | 444,630 | 430,662 | 586,030 |
| Office of the City Clerk | 288,863 | 305,353 | 349,114 | 370,153 |
| Office of the City Attorney | 238,895 | 244,131 | 253,755 | 253,755 |
| Human Resource Department | 265,320 | 283,504 | 355,076 | 344,586 |
| Finance /Budget | 763,700 | 719,957 | 866,829 | 891,584 |
| IT Department | 357,016 | 381,487 | 423,565 | 420,808 |
| Planning Department | 85,406 | 112,047 | 93,824 | 116,112 |
| Police Department | 7,317,607 | 7,858,419 | 8,485,955 | 9,469,594 |
| Police – School Guards | 13,664 | 22,150 | 28,733 | 33,740 |
| Code Compliance | 226,254 | 227,573 | 310,376 | 357,056 |
| Public Services – Administration | 444,664 | 415,358 | 485,631 | 544,916 |
| Public Services – Streets | 394,038 | 488,350 | 378,975 | 392,421 |
| Public Services – Properties | 743,636 | 732,182 | 928,291 | 1,219,711 |
| Public Services – Building Maintenance | 741,388 | 419,816 | 419,080 | 458,388 |
| Public Services – Fleet Maintenance | 64,349 | 97,401 | 40,500 | 47,500 |
| Recreation | 1,461,195 | 1,697,439 | 1,928,809 | 1,882,664 |
| Pool | 556,019 | 618,576 | 685,990 | 732,508 |
| Tennis | 38,156 | 35,685 | 53,399 | 53,550 |
| Park Maintenance | 283,507 | 310,715 | 412,601 | 413,221 |
| Golf Administration | 10,981 | 12,922 | 13,132 | 9,355 |
| Golf Pro Shop | 774,703 | 816,377 | 725,254 | 901,152 |
| Golf Maintenance | 1,222,815 | 1,286,287 | 1,438,216 | 1,714,157 |
| SUB TOTALS | 16,931,431 | 17,695,046 | 19,293,187 | 21,374,803 |
| Transfers to other funds | 1,299,777 | 1,596,746 | 1,476,130 | 1,736,673 |
| Increase (appropriated) fund balance | 1,269,913 | 1,745,113 | ||
| TOTALS | 19,501,121 | 21,036,905 | 20,769,317 | 23,111,476 |
TOP EXPENDITURES – ALL FUNDS
| Top Expenditures – All Funds | |||
| Description | FY 22-23 Amended Budget | FY 23-24 Proposed Budget | % Increase |
| Salaries | 11,212,276 | 12,243,696 | 9% |
| Health Insurance Benefits | 1,644,934 | 1,883,011 | 14% |
| Pension Costs | 882,713 | 975,192 | 10% |
| Workmens Comp | 271,047 | 292,465 | 8% |
| Other Employee Benefits | 851,769 | 934,355 | 10% |
| EMPLOYEE SUB TOTALS | 14,862,739 | 16,328,719 | 10% |
| Capital Expenditures | 658,225 | 168,100 | -74% |
| Debt Service Payments | 1,672,926 | 1,805,985 | 8% |
| Depreciation / Amortization | – | – | |
| Operating Supplies / Uniforms | 1,233,278 | 1,396,384 | 13% |
| Contractual Services | 2,454,779 | 3,006,310 | 22% |
| Waste Disposal | – | – | |
| Transfer to other funds | – | – | |
| Liability Insurance | 636,910 | 1,049,659 | 65% |
| Professional Fees | 627,143 | 626,284 | 0% |
| Management Fee Paid by Enterprise Funds | 130,251 | 130,251 | 0% |
| Fleet Maintenance | 492,599 | 502,513 | 2% |
| Repairs and Maintenance | 1,145,535 | 1,213,933 | 6% |
| Other Misc Expenses | 2,535,412 | 5,773,179 | 128% |
| SUB TOTALS | 11,587,058 | 15,672,598 | 35% |
| TOTAL EXPENDITURES | 26,449,797 | 32,001,317 | 21% |
CITY OF MIAMI SPRINGS EMPLOYEE PAY RANGE:
| FY 2023 – 24 Pay Range | ||
| Position | Minimum | Maximum |
| PRO SHOP CASHIER | 24,960 | 36,866 |
| MAINTENANCE WORKER I | 28,829 | 42,744 |
| PRO SHOP CLERK | 28,829 | 42,744 |
| CLERICAL ASSISTANT | 29,600 | 43,901 |
| REFUSE COLLECTOR | 30,344 | 46,795 |
| MAINTENANCE WORKER II | 31,177 | 50,029 |
| REFUSE TRUCK DRIVER | 32,676 | 52,486 |
| GOLF MAINTENANCE WORKER | 32,676 | 52,486 |
| GYM INSTRUCTOR | 32,676 | 52,486 |
| RECREATION MAINTENANCE WORKER | 32,676 | 52,486 |
| ADMINISTRATIVE ASSISTANT I | 34,333 | 52,951 |
| BUILDING SPECIALIST I | 34,333 | 52,951 |
| MATERIALS MANAGEMENT CLERK | 34,333 | 52,951 |
| POLICE ADMINISTRATIVE SPECIALIST I | 34,333 | 52,951 |
| RECREATION SPECIALIST | 34,333 | 52,951 |
| AQUATIC SPECIALIST | 34,333 | 52,951 |
| HEAVY EQUIPMENT OPERATOR | 34,333 | 52,951 |
| SPECIAL EVENTS/PROGRAM SPECIALIST | 34,333 | 52,951 |
| ACCOUNTING SPECIALIST I | 35,186 | 54,276 |
| BUILDING MAINTENANCE TECHNICIAN | 35,186 | 54,276 |
| GOLF COURSE SPRAY/APPLICATOR TECM | 35,186 | 54,276 |
| AUTOMATED EQUIPMENT OPERATOR | 37,899 | 62,631 |
| PUBLIC PROPERilES FOREMAN | 37,899 | 62,631 |
| STREETS FOREMAN | 37,899 | 62,631 |
| ACCOUNTING SPECIALIST II | 40,810 | 60,517 |
| ADMINISTRATIVE ASSISTANT II | 40,810 | 60,517 |
| ASSISTANT SENIOR CENTER MANAGER | 40,810 | 60,517 |
| ASSISTANT TO THE CITY CLERK | 40,810 | 60,517 |
| BUILDING MAINTENANCE SPECIALIST | 40,810 | 60,517 |
| BUILDING SPECIALIST II | 40,810 | 60,517 |
| PROCUREMENT SPECIALIST | 40,810 | 60,517 |
| POLICE DISPATCHER-TRAINEE | 41,771 | 62,656 |
| ADMINISrRA TIVE ASSISTANT Ill | 42,879 | 64,449 |
| AQUATIC COORDINATOR | 42,879 | 64,449 |
| BUILDING SPECIALIST Ill | 42,879 | 64,449 |
| GOLF MAINTENANCE MFCHANlC | 42,879 | 64,449 |
| POLICE ADMINISTRATIVE SPECIALIST | 42,879 | 64,449 |
| RECREATION COORDINATOR | 42,879 | 64,449 |
| RECREATION MAINTENANCE SUPERVISOR | 42,879 | 64,449 |
| SANITATION FOREMAN | 42,879 | 64,449 |
| GOLF MAINTENANCE SUPERVISOR/FOREMAN | 43,961 | 65,954 |
| POLICE DISPATCHER I | 43,961 | 65,954 |
| PRO SHOP/OUTSIDE SERVICES MANAGER | 43,961 | 65,954 |
| ACCOUNTING SPECIALIST Ill | 46,159 | 69,251 |
| ATHLETIC SUPERVISOR | 46,159 | 69,251 |
| HUMAN RESOURCES SPECIALIST II | 46,159 | 69,251 |
| POLICE ADMINISTRATIVE SPECIALIST III | 46,159 | 69,251 |
| POLICE DISPATCHER II | 46,159 | 69,251 |
| CODE COMPLIANCE OFFICER | 46,646 | 69,738 |
| EXECUTIVE ASSISTANT TO THE CHIEF OF PCLICE | 46,646 | 69,738 |
| AQUATIC SUPERVISOR | 47,331 | 70,183 |
| POLICE COMMUNICATIONS SUPERVISOR | 47,331 | 70,183 |
| DEPUTY CITY CLERK | 48,094 | 70,726 |
| PUBLIC INFO & PROF SERVICES SPECIALIST | 48,094 | 70,726 |
| ASSISTANT IT MANAGER | 52,826 | 78,938 |
| PUBLIC WORKS OPERATIONS MANAGER | 52,826 | 78,938 |
| SPECIAL EVENTS/PROGRAMS SUPERVISOR | 52,826 | 78,938 |
| SENIOR PROCUREMENT OFFICER | 56,405 | 82,229 |
| GRANT WRITER & PUBLIC INFORMATION SPECIALIST | 59,102 | 87,652 |
| POLICE NETWORK ADMINISTRATOR | 59,102 | 87,652 |
| POLICE OFFICER· RECRUlT | 59,102 | 87,652 |
| SENIOR CENTER MANAGER | 60,786 | 89,846 |
| ASSISTANT PUBLIC WORKS DIRECTOR | 62,401 | 92,542 |
| ClTY PLANNER | 68,875 | 102,148 |
| GOLF SUPERINTENDENT | 70,599 | 107,840 |
| CONTROLLER | 80,977 | 117,743 |
| HUMAN RESOURCES DIRECTOR/RISK MANAGER | 80,977 | 117,743 |
| INFORMATION TECHNOLOGY DIRECTOR | 80,977 | 117,743 |
| CITY CLERK | 90,091 | 120,120 |
| GOLF & COUNTRY CLUB DIRECTOR | 90,091 | 120,120 |
| PUBLIC WORKS DIRECTOR | 90,091 | 120,120 |
| RECREATION DIRECTOR | 90,091 | 120,120 |
| POLICE CAPTAIN | 90,091 | 120,120 |
| ASSISTANT CITY MANAGER | 112,531 | 156,000 |
| BUILDING OFFICIAL & CODE COMPLIANCE DIRECTOR | 112,531 | 156,000 |
| FINANCE DIRECTOR | 112,531 | 156,000 |
| CHIEF OF POLICE | 115,599 | 165,372 |
Note: There’s another budget workshop meeting coming on Monday, August 21st.


")


